Every open-pit mine measures truck queue time and digger hang time. Most blame the dispatcher when the numbers look bad. That is the wrong target. Dispatch has a ceiling, and everything above it belongs to someone else.
Queue time and hang time are the two metrics that define whether a fleet is running well. Too much queue means trucks are sitting at the face burning fuel and doing nothing. Too much hang time means the digger, the most expensive asset on the bench, is sitting idle between loads. Every mine controller and dispatch supervisor knows the feeling of watching those numbers climb during a shift and trying to claw them back with truck reassignments.
The problem is not the metrics. The problem is the assumption baked into how most sites use them: that queue and hang are dispatcher problems.
They are not. Not entirely. The gap between what dispatch can actually control and what gets dumped on the dispatcher’s desk is where most sites are bleeding production without realising it.
Three layers of production loss
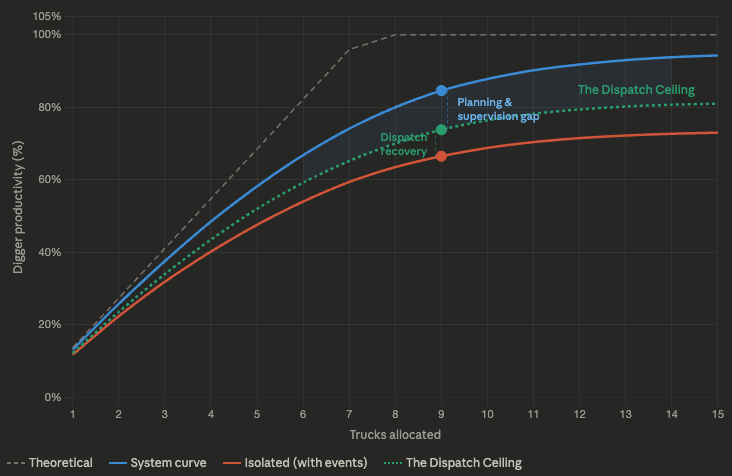
Take a fleet of trucks matched to a set of diggers. In a perfect world, every truck runs an identical cycle time, arrives perfectly spaced, and nothing ever breaks or stops. Production scales linearly with truck count until the digger is fully saturated. That is the theoretical maximum. Nobody operates there. It exists only as a reference point.
Now add reality. Even with zero interruptions, trucks do not run identical cycles. Road conditions vary. Operators drive differently. Traffic at intersections and dumps creates variation. A truck nominally running a 30-minute cycle might come back in 26 minutes or 34 minutes.
That variation alone causes bunching. Two trucks arrive together, one queues. Then a gap opens and the digger hangs. This is the system curve: the best the fleet can do with natural variance and nothing else going wrong.
The gap between theoretical and the system curve is the cost of operating in a variable environment. You cannot eliminate it. You can reduce it with better roads, consistent operator standards, and traffic management, but it never goes to zero. The maths guarantee it.
Now layer on what actually happens during a shift. Trucks get pulled for refuelling. Operators take crib breaks. Pre-starts run long. A tyre check holds a truck at the workshop for an extra ten minutes. Meanwhile, the digger takes a short move, waits for a dozer pushup, gets held for a grade control check, or stops while the face is cleaned up. These are event disruptions, and they hit both sides of the system independently.
When a truck cops a delay, it comes back late. But the impact does not stop there. A ten-minute refuelling stop does not cost ten minutes of production. The truck travels off-cycle to reach the fuel bay, crawls through low-speed entry and exit points, then has to reposition back into the haul route. By the time it rejoins the fleet it is out of sequence, and the spacing for every truck behind it is disrupted. The impact compounds through the cycle.
When the digger stops for a cleanup without informing Dispatch prior, every truck assigned to it queues up. If the stop is short, the trucks absorb it. If it runs long, you have a bank of trucks sitting idle and a digger that restarts with a queue it did not need.
This is the isolated curve: what production looks like when every truck runs its assigned loop with disruptions happening and nobody intervening. No dispatcher. No cross-allocation. Just the raw operational reality.
What dispatch actually recovers
A good dispatcher (or a good FMS algorithm) sees the disruptions and reacts. One digger goes down for a face cleanup, and the dispatcher sends those trucks to a digger that has capacity. A truck is delayed at the fuel bay, so the algorithm adjusts assignments to keep the remaining diggers fed. This cross-allocation is the core value proposition of dynamic dispatch, and it works.
But it only works when the disruptions are uneven. If Digger A is down and Digger B has spare capacity, there is somewhere to send the trucks. If every digger goes down at the same time, or if every truck hits a delay in the same window (mass crib break, shift changeover), there is nowhere to send anyone. The dispatcher is stuck.
The production recovered by cross-allocation is real and measurable. It is the difference between the isolated curve and what I call the dispatch curve: the best achievable production when a competent dispatcher is actively managing the fleet. On a typical three-digger operation, this recovery can be 300 to 500 tonnes per hour. That is not trivial.
But here is what most sites miss: the dispatch curve is not the system curve. There is still a gap. And that gap is not a dispatch problem.
The Dispatch Ceiling
The distance between the system curve (what the fleet could do with just natural variance) and the dispatch curve (the best the dispatcher can achieve with active management) is what I call the Dispatch Ceiling. It is the hard limit on what dispatch can deliver. Everything above it is production that no amount of truck allocation, no FMS algorithm, no dispatcher skill can recover.
The gap above the ceiling exists because of the events themselves:
- A refuelling bay that is off cycle, adding ten minutes to every refuel cycle
- Face cleanups that are not advised to dispatch proactively
- The cycle that does not have a toilet on the run, resulting in off-cycle travel every time an operator needs a break
- A tip head that is not big enough to take all the trucks, so they queue waiting for a tip point
- A lack of active tip heads that can be used based on operational requirements
- Ore spotters that could have been ready and waiting before the digger reached the ore contact
- The dozer that is tramming down the ramp that is the main access for three shovels, interrupting truck flow until it is off the road
- The digger is continually interrupting the load cycle to handle oversize material
The face cleanup example deserves attention because it exposes the mechanics of why dispatch cannot recover certain losses.
Every haul route has a final decision point: the location where a truck commits to its loading unit and can no longer be economically redirected. Once a truck passes that point, it is going to the digger regardless of what happens when it gets there. If the digger operator calls a cleanup with five minutes warning, dispatch can redirect trucks prior to the final decision point or look for other opportunities to effectively manage the truck. If the digger just stops, every truck that is already past the final decision point arrives at a queue that did not exist when it was assigned.
The dispatcher did not create that queue. The five-minute heads up radio call that never happened created it. Geography and timing made it unrecoverable.

These are planning decisions and supervision failures. The dispatcher inherits them. Queue time goes up. Hang time goes up. The numbers look bad. And the dispatcher gets the conversation about why production was short.
Adding trucks does not raise the ceiling
The instinct when production is short is to throw more trucks at the problem. I have lost count of the number of times a supervisor has called dispatch and said “run everything we have.”
It is an expensive wrong answer that provides diminishing returns with every truck thrown in the run. Sometimes it is worse than expensive. The extra traffic increases congestion at intersections, ramps, and dumps, which increases cycle time variability across the entire fleet. More trucks can actually reduce total output. The operation gets louder and busier and moves less dirt.
Once a fleet is operating at or above the Dispatch Ceiling, additional trucks do not meaningfully increase digger productivity. They increase queue time. Every extra truck past the saturation point spends more of its cycle waiting at the face than hauling. The digger is not loading faster. It is just managing a longer line.
The maths are brutal. A fleet sitting just above the saturation knee might see a 1 to 2 percent TPH gain from adding another truck, but a 30 to 40 percent increase in average queue time per truck. You are paying for fuel, tyres, maintenance, and an operator seat to produce marginal tonnes that could have been unlocked for free by reducing digger disruption by two minutes per hour.
This is the test: if your fleet is saturated and production is still short, the constraint is not truck count. It is what happens when the trucks get there. Reducing a five-minute-per-hour digger disruption to three minutes will recover more tonnes than a truck that costs you north of $500 per operating hour to run.
But that reduction requires someone to schedule the dozer before the digger needs it, not after. A supervision win, not a dispatch win, and definitely not a capital expenditure decision.
Stop measuring dispatch against the theoretical line
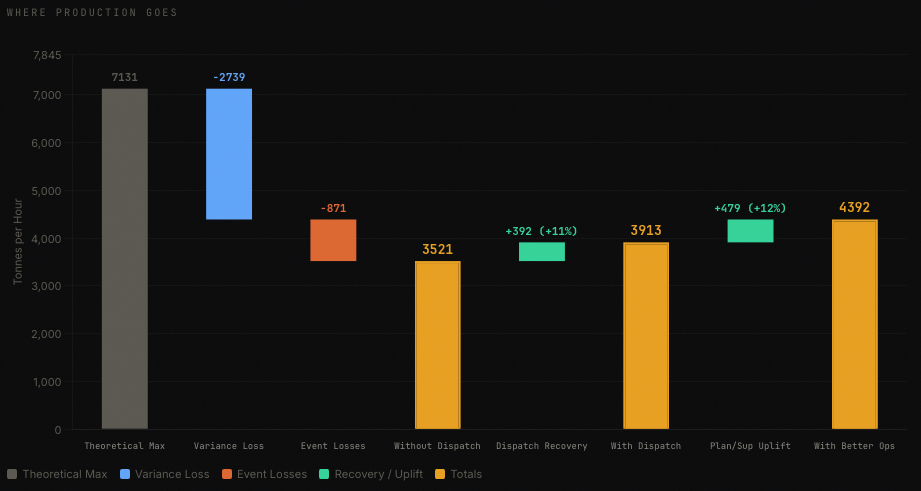
Most sites compare actual production to the theoretical maximum and call the difference a dispatch gap. That framing is wrong. It conflates three completely different categories of loss:
Variance loss is the cost of operating in a variable system. Better roads, better operator training, consistent truck speeds, and better traffic management can reduce it, but it is an infrastructure and standards problem, not a dispatch problem.
Event loss is the cost of disruptions that pull trucks and diggers out of productive time. Dispatch can partially recover this through cross-allocation, but the events themselves are a planning and supervision problem. The dozer or drill tramming on the haul route. The grader that is grading the main haul road while the full fleet is running. The dump that trucks have to crawl over because it has not been maintained.
None of these are dispatch decisions. All of them show up in the dispatcher’s numbers.
The Dispatch Ceiling is the residual production loss after dispatch has done everything it can. It only closes when someone addresses the root causes. Where the refuelling bay is. Scheduling a drill move to minimise haul route disruption. Whether grade control is proactive or reactive.
If you are measuring your dispatcher against the theoretical line, you are holding them accountable for losses they cannot control.
Who owns which loss
| Loss Category | What It Looks Like | Owner | How It Closes |
|---|---|---|---|
| Variance loss | Truck cycle times spread around the mean, causing bunching and gaps | Roads / Maintenance / Training | Road grading, operator coaching, traffic management, dump and intersection design |
| Event loss (truck) | Off-cycle travel to fuel bays, no toilet on the run, tip head too small, congestion from auxiliary equipment on haul routes | Planning / Supervision | Fuel bay and toilet placement on cycle, dump design, auxiliary movement scheduling |
| Event loss (digger) | Face cleanups, short moves, dozer waits, grade control holds | Supervision / Planning | Digger operator proactively calling cleanups, grade control completed before the digger arrives, addressing long spot times |
| Dispatch recovery | Cross-allocation of trucks between diggers during disruptions | Dispatch / FMS | Better algorithms, competent dispatchers, real-time visibility |
| The Dispatch Ceiling | The residual gap between dispatch-best and system-potential | Mine Planning / Supervision | Infrastructure placement, scheduling discipline, operational standards |
This table is the audit. If your site cannot attribute losses to these categories, you do not have a dispatch problem. You have a visibility problem.
What to do with this
The first step is separating the signal. When queue time spikes, the question should not be “what did the dispatcher do wrong?” It should be “what caused the spike?”
If trucks are queuing because the digger took an unplanned short move, that is a supervision issue. If the refuelling run adds fifteen minutes because the fuel bay is off cycle, that is a planning issue. If trucks are queuing because three came back from refuelling at the same time or because the dispatcher left too many assigned to a digger that was already saturated, that is a dispatch issue.
A useful shift-end check: compare what the dispatcher recovered against what was left on the table. If the isolated curve says 3,500 TPH and dispatch delivered 3,900 TPH, that is 400 tonnes per hour of genuine dispatch value. If the system curve says 4,400 TPH, there is still a 500 TPH gap that belongs to planning and supervision. The dispatcher did their job. The question is whether anyone else did theirs.
None of this decomposition works if your time model codes every truck waiting at the face as queue. If the digger is on a delay and the truck is waiting for that delay to end, that time belongs to the delay, not to dispatch. Most sites I have seen do not code it that way. The dispatcher ends up wearing tonnes that belong to a cleanup nobody called up for, and the supervisor’s delay looks like a clean ten-minute stoppage with no flow-on cost. Before you can measure the ceiling, the coding has to separate what dispatch could recover from what it could not. Every modern FMS knows which equipment is on which state code at any given second. Sites choose to lump waits into queue because it is simpler for the report, and dispatch wears the aggregate.
This is not just about holding other functions accountable. Dispatchers need to be part of closing the gap. They are the ones who see the dozer on the ramp, the grader on the haul road at peak traffic, the digger that stops without warning. They see it in real time, before it shows up in any report.
Sites that encourage dispatchers to flag these events to supervision as they happen, not just log them after the fact, create a feedback loop. It may be too late to recover the tonnes today. But if the supervisor knows that yesterday’s face cleanup cost 200 tonnes because dispatch was not advised, tomorrow’s cleanup gets a radio call five minutes earlier. That is how the ceiling lifts: one operational habit at a time.
Most FMS platforms do not make this separation easy. They report queue and hang as aggregate numbers and leave it to the user to figure out why. The data to decompose the signal is usually there, buried in event logs and status changes. Nobody has built the workflow to surface it in a way that drives accountability to the right function.
Until they do, the dispatcher will keep absorbing losses that belong somewhere else. And the Dispatch Ceiling will keep hiding in plain sight, protected by the assumption that if queue time is high, someone in the control room must be doing a bad job.
The ceiling is real. It is quantifiable. And it will not raise until someone other than the dispatcher owns what sits above it.
The Fleet Saturation Simulator on MiningFMS lets you model these curves interactively. Adjust truck counts, variance, disruption rates, and dispatch priority to see how the Dispatch Ceiling behaves across different fleet configurations.