A haul truck sits idle at the fuel bay for twelve minutes at shift change. The day shift dispatcher logs it as refuelling. The night shift calls it standby. By the end of the month, the fleet’s utilisation number is a fiction that nobody trusts.
This is what happens without a Time Usage Model (TUM). Every mine has one, whether they built it deliberately or inherited it from a vendor default. The TUM classifies every minute of an asset’s life into defined categories: what was it doing, when, and for how long? From those categories flow the KPIs that run the operation, including Availability, Utilisation, and Productivity.
Most mines find that their TUM problems are not technical. They are definitional. Is low truck production a maintenance issue or an operational one? Is fleet availability genuinely improving, or has someone changed the way downtime is recorded? A TUM that answers those questions honestly is worth the effort. One that papers over them is worse than having no model at all.
The Structure of a Time Usage Model
No TUM is inherently right or wrong. A model that works at a Pilbara iron ore operation may be completely wrong for an underground gold mine in Kalgoorlie. The structure depends on the mining method, the maintenance strategy, the contractual arrangements, the technology on the trucks, and the questions management needs the data to answer.
One principle is non-negotiable: a TUM must account for 24 hours in every day. Every minute lands somewhere. If your site has a one-hour shift gap, that hour must sit in the model, not vanish. The moment time disappears, the KPIs built on it are meaningless.
The model is a hierarchy of nested categories. Calendar Time sits at the top, and each level below divides time into progressively more specific classifications. The common mistake is building too many levels. Some operations run two tiers. Large complex sites with multiple mining methods may need six. What matters is that each level adds a meaningful distinction, and that the operator in the cab can reliably tell the difference between one category and another. If they cannot, you get noise, not insight.
Two rules hold the hierarchy together. Categories must be mutually exclusive (a block of time can only belong to one category) and collectively exhaustive (every block of time belongs somewhere). Break either rule and the 24-hour accounting principle collapses.
Data is only ever captured at the lowest level. Everything above is derived by rolling up what sits beneath. In practice, this means the entire model depends on what gets recorded at the leaf level. A well-designed upper structure cannot compensate for poor data entry at the bottom.
Time Classification Example
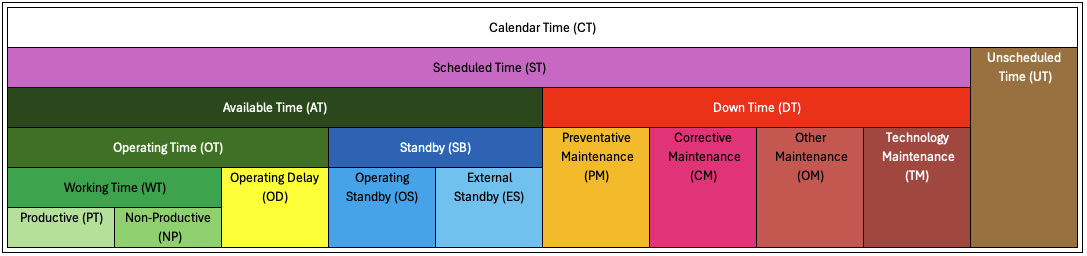
The hierarchy below is modelled on the GMG Standardized Time Classification Framework for Mobile Equipment in Surface Mining, with modifications to the Down Time classification.
| Category | Description |
|---|---|
| Calendar Time (CT) | The total time in any reporting period. Every other category sits within this. A 24-hour equipment day contains 86,400 seconds of Calendar Time regardless of what the machine did. |
| Scheduled Time (ST) | The portion of Calendar Time the asset is scheduled to operate. |
| Unscheduled Time (UT) | Time the asset is not rostered to operate. Public holidays, planned standdowns, and seasonal demand reductions are typical examples. |
| Available Time (AT) | The portion of Scheduled Time where the asset is mechanically available and able to perform its function. |
| Down Time (DT) | The portion of Scheduled Time where the asset is not fit for service due to maintenance reasons. |
| Preventative Maintenance (PM) | Planned servicing carried out to prevent failure. Scheduled services and component change-outs are typical examples. |
| Corrective Maintenance (CM) | Unplanned repairs carried out in response to a failure or defect. Breakdowns and reactive fixes sit here. |
| Other Maintenance (OM) | Maintenance activity that does not fit Preventative or Corrective. Examples could be GET replacement, Inspections, Accident Damage. |
| Technology Maintenance (TM) | Downtime attributed to onboard technology systems. FMS hardware faults, Collision Avoidance faults, Two Way Radio outages etc. |
| Operating Time (OT) | The portion of Available Time where the asset is actively being used. |
| Standby (SB) | The portion of Available Time where the asset is fit and ready but not operating. |
| Operating Delay (OD) | Time within Operating Time consumed by necessary non-productive cycle activities. Refuelling, pre-start checks, and repositioning/travel are typical examples. |
| Working Time (WT) | The time the asset is actively on task and producing outputs. |
| Operating Standby (OS) | Standby time attributable to operational causes. Blasting, traffic holds, Access issues are typical examples. |
| External Standby (ES) | Standby time attributable to causes outside the operation’s direct control. |
| Productive Time (PT) | The portion of Working Time spent on the primary task. Hauling, loading, and drilling are typical examples. |
| Non-Productive Time (NP) | Working Time that is on-task but not contributing directly to production. Respot, Redrills and assist activities are typical examples. |
Key Performance Indicators: PA, Utilisation, and UoA
The TUM drives the KPIs that every mining operation tracks. Exact definitions vary across the industry (and this remains a persistent source of confusion), but most models produce three core metrics. For a deeper treatment of how these interact, see Availability, Utilisation and Productivity.
Physical Availability (PA): Available Time divided by Scheduled Time. A measure of maintenance effectiveness. A haul truck fleet targeting 85 to 90% PA is in a healthy range. Sustained performance below 80% signals systemic issues.
Utilisation: Operating Time divided by Available Time. A measure of operational efficiency, reflecting how effectively available time converts into work. High availability with low utilisation points to queueing, idle time, or shift change losses. This is where dispatch systems and pit design have the most influence.
Use of Availability (UoA): Operating Time divided by Scheduled Time, or Availability multiplied by Utilisation. This reveals the compounding effect. An operation with 88% Availability and 80% Utilisation achieves a UoA of only 70.4%. Nearly 30% of scheduled time is not productive, and the losses are invisible if you only watch PA and Utilisation separately.
Building Your Own Time Usage Model
Start with the GMG Time Classification Framework or a similar industry-accepted structure rather than building from scratch. This gives you a proven hierarchy, established definitions, and the ability to benchmark against peers. Customise where necessary, but maintain alignment at the upper levels so your numbers mean the same thing as the operation next door.
The right level of granularity depends on how the data will be used. Too few categories and you cannot pinpoint improvement opportunities. Too many and you create a data capture burden that leads to misclassification. Most operations settle on three to four levels with 15 to 40 leaf-level categories. If a classification relies entirely on manual input, consider whether the data quality will justify it. A delay code that operators cannot distinguish from its neighbour will be used randomly.
The TUM sits at the intersection of operations and maintenance. Both teams must understand and accept the definitions. If they are arguing about whether an event is a breakdown or an operational delay, the model is not serving its purpose. Document every category with clear definitions and examples, and review classifications against actual data at least quarterly.
Aligning the TUM with Operational Incentives
The TUM feeds KPIs, and those KPIs are tied to targets, contracts, bonuses, and management decisions. If classifications do not match operational reality, they drive the wrong behaviour. In practice, the TUM is a behavioural tool as much as a reporting one. Get the incentives wrong and the data will tell you exactly what people think you want to hear.
Opportune Maintenance Under MARC Contracts
On sites with Maintenance and Repair Contracts (MARC), the maintenance provider is measured against availability targets. If opportune maintenance, meaning minor work done when equipment is genuinely not needed for production, is classified as downtime, the maintainer faces a clear choice: do the work and guarantee recorded downtime, or leave it and avoid the penalty. The rational decision is to leave it.
The consequence is predictable. Minor issues develop into genuine failures during critical production periods. The solution is to classify opportune maintenance as a non-down code. The equipment was not required for production anyway; penalising the maintainer for using that window productively is counterproductive.
Ground Engaging Tools and Reliability Metrics
Where an operation runs ground engaging tools (GET) such as bucket teeth, lip shrouds, and wear plates to failure or near-failure as a deliberate policy, those replacements should not be classified as unplanned maintenance. If they are, every change event is recorded as a failure, directly impacting Mean Time Between Failure (MTBF). The fleet appears unreliable when it is simply following a consumable management policy.
The appropriate response is a separate classification such as Other Down or Planned Consumable Replacement. The downtime is still captured, but reliability metrics reflect genuine equipment reliability rather than policy decisions.
Technology Downtime
Most TUMs were designed when a two-way radio was the only technology that could park up a truck. Today, equipment carries Fleet Management Systems, fatigue monitoring, dashcams, live cameras, proximity detection, and collision avoidance. Each can independently down a machine if it malfunctions.
Should a truck with a faulty fatigue camera be classified the same as one with a hydraulic failure? The engine, drivetrain, and hydraulics are perfectly functional, yet the truck is down because site policy rightly requires the safety system to be operational. Lumping technology failures with mechanical failures distorts reliability metrics and obscures what may be an IT/OT issue managed by a completely different team.
A dedicated Technology Down classification gives the technology team visibility on production impact, enables targeted improvement, and keeps mechanical reliability metrics clean. As on-board technology grows, this category deserves deliberate treatment in every TUM.
The Underlying Principle
The same logic applies elsewhere. Pre-start inspections classified as delays incentivise operators to rush them. Fuelling counted against utilisation encourages empty handoffs at shift change. Blast clearance penalising utilisation creates pressure to shorten exclusion zones. In each case, the question is the same: does the classification encourage the behaviour you actually want? If not, the model needs to change.
Time Usage and Mine Planning
The TUM does not just report on yesterday. Every mine plan and production budget is a forward-looking version of the time usage model: a prediction of how every hour of fleet time will be classified.
The budget starts from a zero-base fleet model. Planned maintenance hours come from service schedules and component life forecasts. Breakdown allowances come from historical reliability. Shift change provisions, pre-start allowances, weather, and blast clearances each map to a TUM category. If the TUM categories in reporting do not align with those used to build the budget, variance analysis is meaningless. An apparent availability shortfall may simply be a definitional mismatch.
When the TUM is consistent between planning and reporting, variance analysis becomes a genuine diagnostic tool. Excess unplanned maintenance signals the maintenance team. High standby time triggers investigation into dispatch or fleet sizing. Weather overruns tell the planners to revisit their assumptions.
The quality of the plan is only ever as good as the data it is built from. Two years of accurate, consistently classified data produces a credible budget. Inconsistent data produces a plan nobody trusts, and a plan nobody trusts is a plan nobody follows.
Changing the TUM Breaks the Budget
This is why change management matters. A simple reclassification can break the link between plan and actuals.
Take a site that counts Daily Service as Preventative Maintenance. If someone moves that block of time to refuelling under Operating Delay, Availability goes up, Utilisation changes (depending on the formula), and productivity per Operating Hour drops. Nothing has actually changed on the ground, but the metrics that drive the budget no longer align with the metrics that measure the actuals.
Key Takeaways
- Account for all 24 hours. If time vanishes from the model, every KPI built on it is a guess. Check your TUM adds up to Calendar Time before trusting any derived metric.
- Design for the operator in the cab, not the engineer in the office. If two categories are indistinguishable at the point of data entry, merge them. A simpler model with clean data beats a detailed model full of noise.
- Align classifications with incentives. Check whether your TUM penalises behaviours you actually want (opportune maintenance, thorough pre-starts, safety system compliance). If it does, fix the model before it fixes the behaviour.
- Keep planning and reporting on the same model. If budget assumptions use different TUM categories from operational reporting, variance analysis is meaningless. Lock the categories before the budget cycle starts.
- Treat TUM changes like mine plan changes. Any reclassification that moves time between Availability and Utilisation will break historical comparisons. Document the change, restate prior periods where possible, and communicate the impact before the numbers hit the monthly report.
References and Further Reading
Global Mining Guidelines Group (GMG), 2020. A Standardized Time Classification Framework for Mobile Equipment in Surface Mining: Operational Definitions, Time Usage Model, and Key Performance Indicators.
Ballantyne, R., 2019. Challenging the Norms — Time Usage Model for Mobile Underground Mining Equipment